BLOG
The eCommerce Statistics Report Q3 2017
Published: Oct 24, 2017

Yieldify gathered data from 400 e-commerce websites across the world in order to show you the latest industry trends in Q3 2017. Here’s what we found…
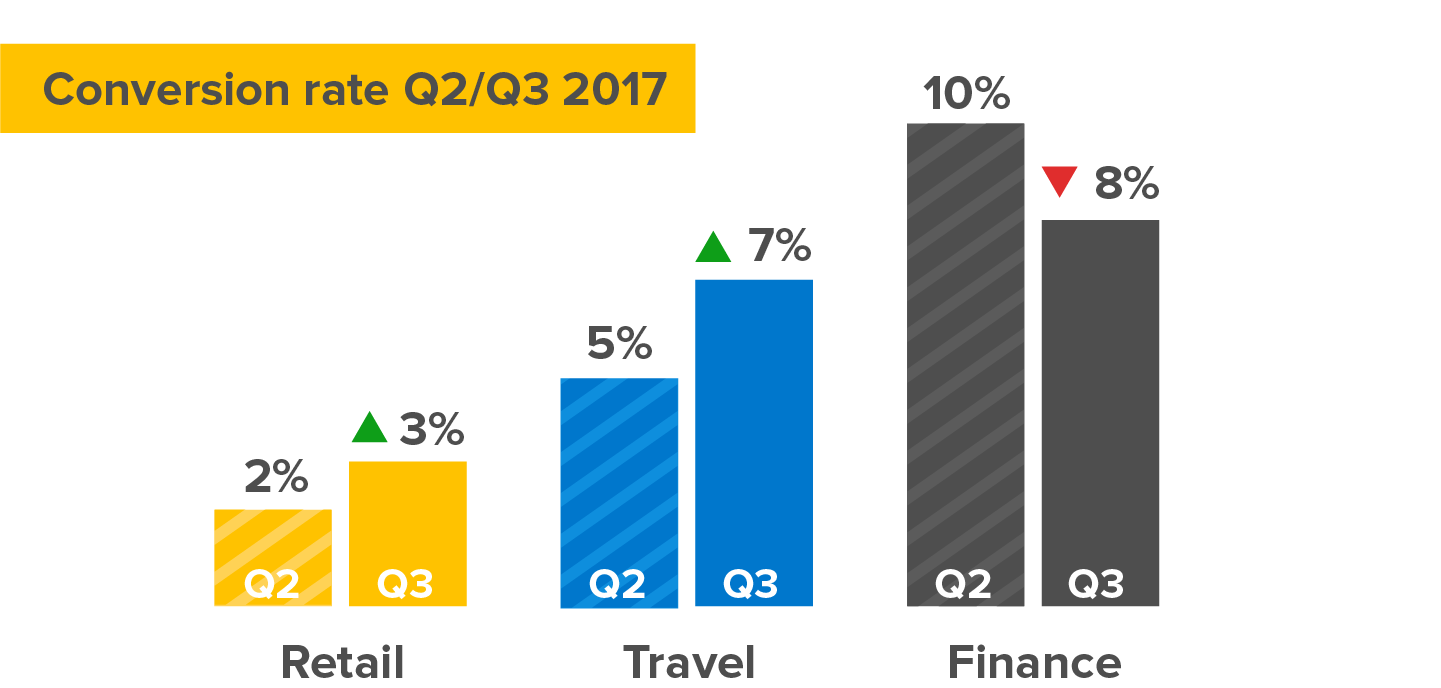
How have conversion rates changed this quarter?
Conversion rates in retail grew consistently over the summer, with travel also taking a leap towards the end of the quarter. Finance, on the other hand, saw a decline…
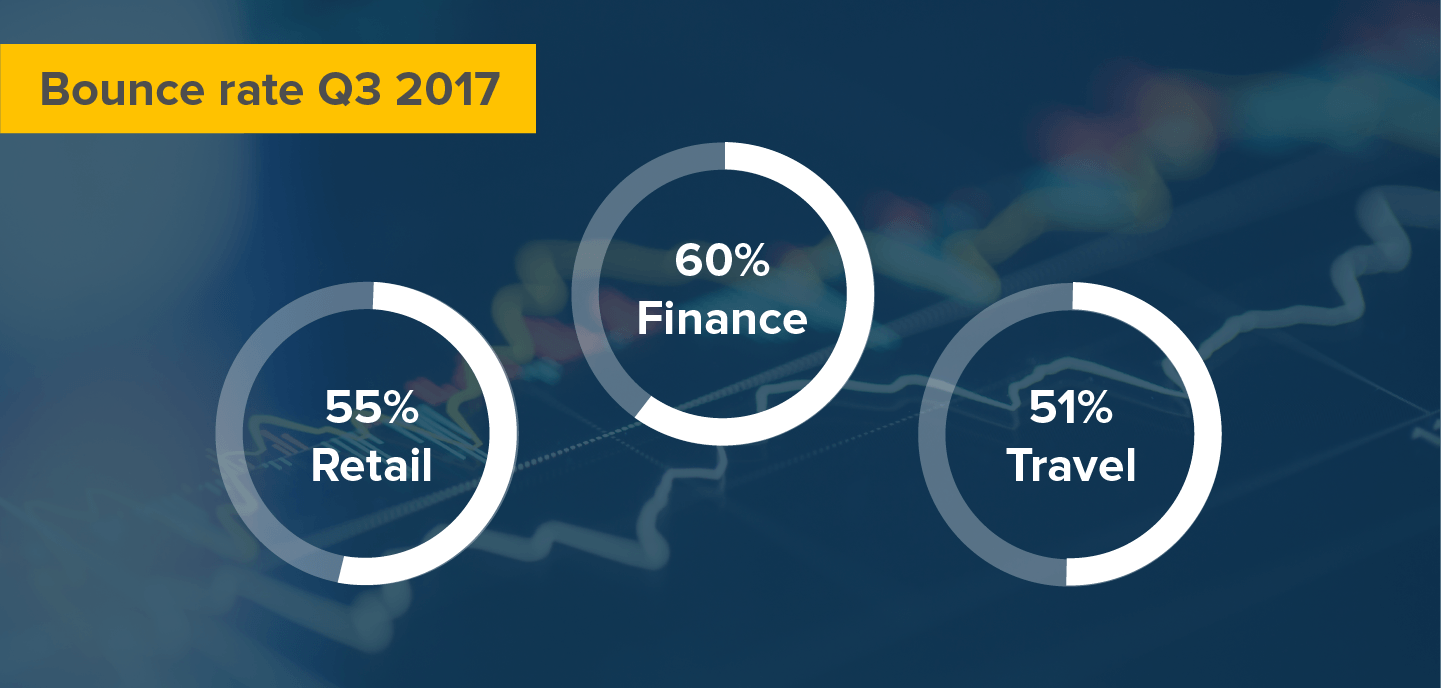
Finance suffers the highest bounce rate
While each vertical loses half of its visitors immediately, finance websites struggle the most with getting their traffic to linger.
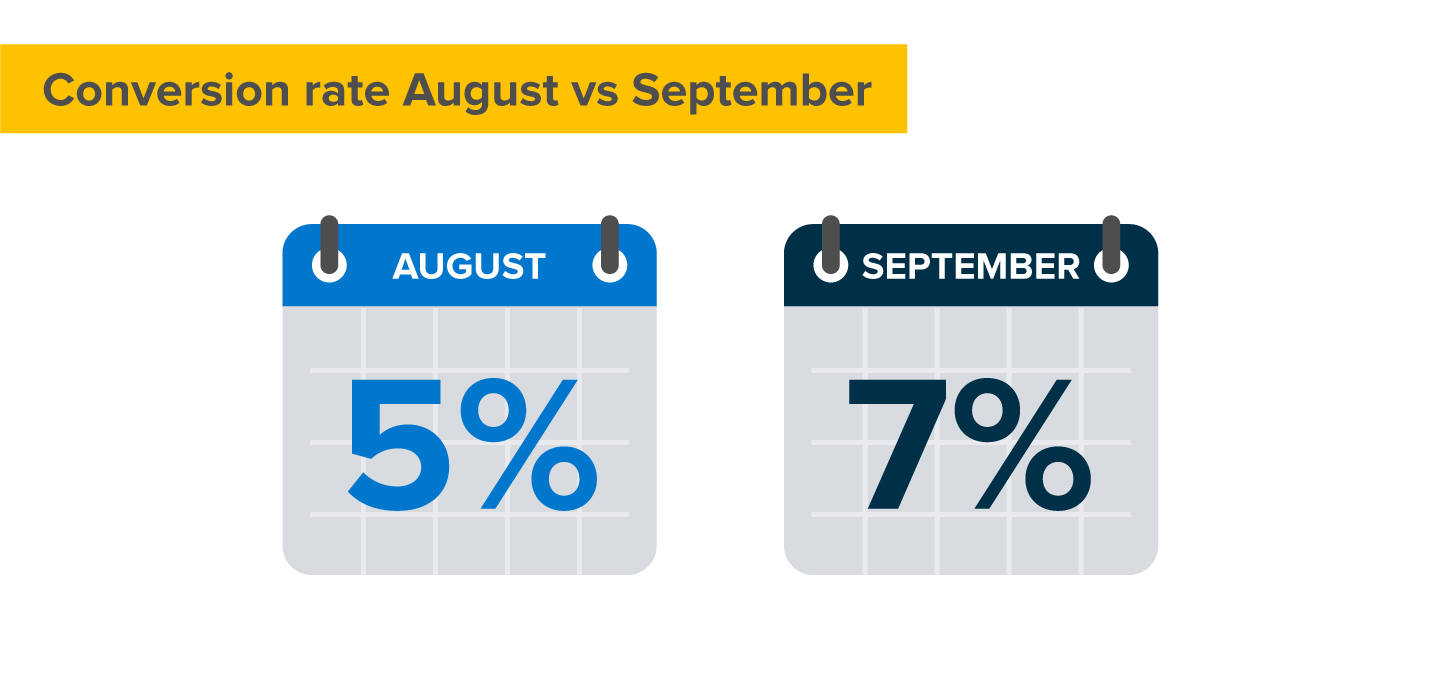
Customers researched holidays in August, but purchased in September
New visitor traffic to travel e-commerce sites peaked at 65% in August – however, conversion rates only rose from 5% to 7% in September.
This could mean customers are waiting for more affordable travel packages. Are you highlighting your best deals?
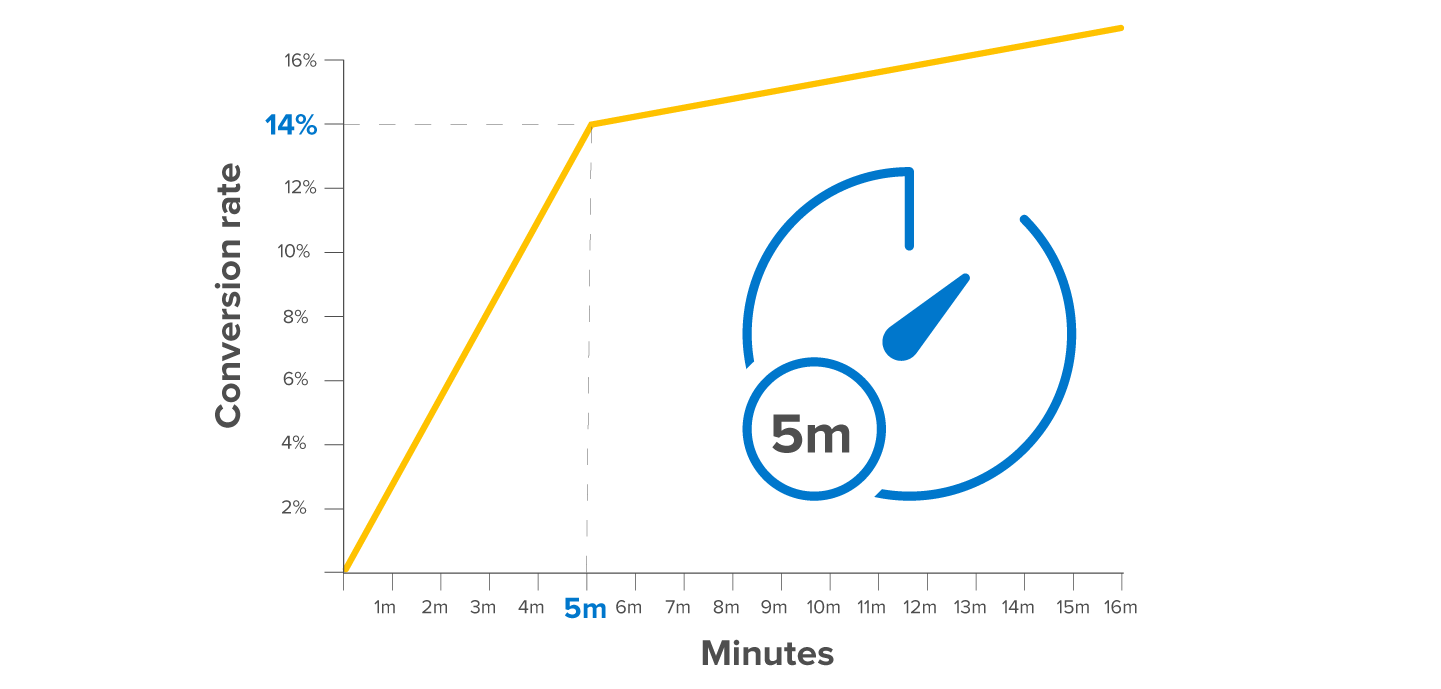
The 5-minute mark
The likelihood of retail e-commerce customers converting increases up to 14% after 5 minutes. As you’d expect, the trend continues the longer a customer stays on site – does your site’s CR trend reflect this?
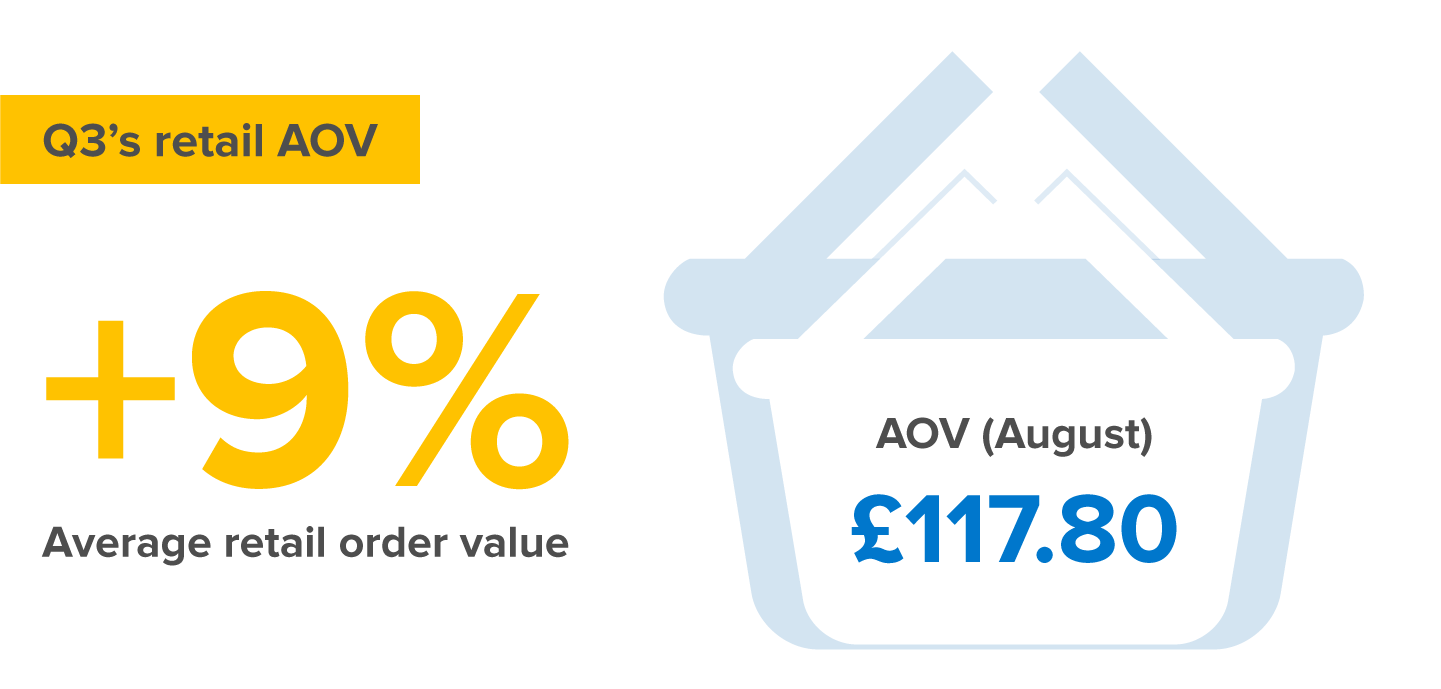
Q3’s retail AOV grew
Average retail order value grew 9% from its level in Q2, with AOV peaking at £117.80 in August. Those summer sales were popular…
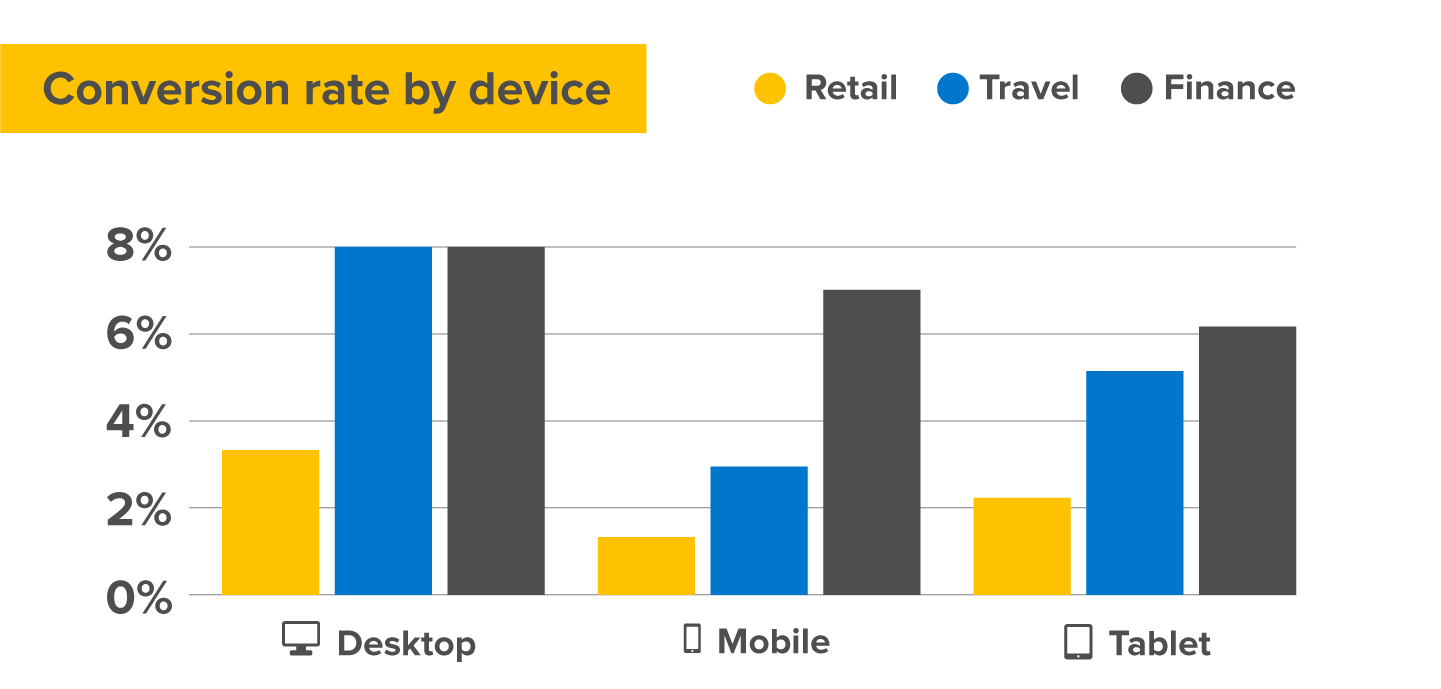
Desktop is still king for conversions
Mobile might be the device to watch when it comes to traffic, but desktop still wins when it comes to conversion rates.
Does your e-commerce store match up to what you see here? If not, we can help. Get in touch with us and we’ll help you turn your traffic into sales.