BLOG
The E-Commerce Statistics Report Q2 2017
Published: Jul 26, 2017
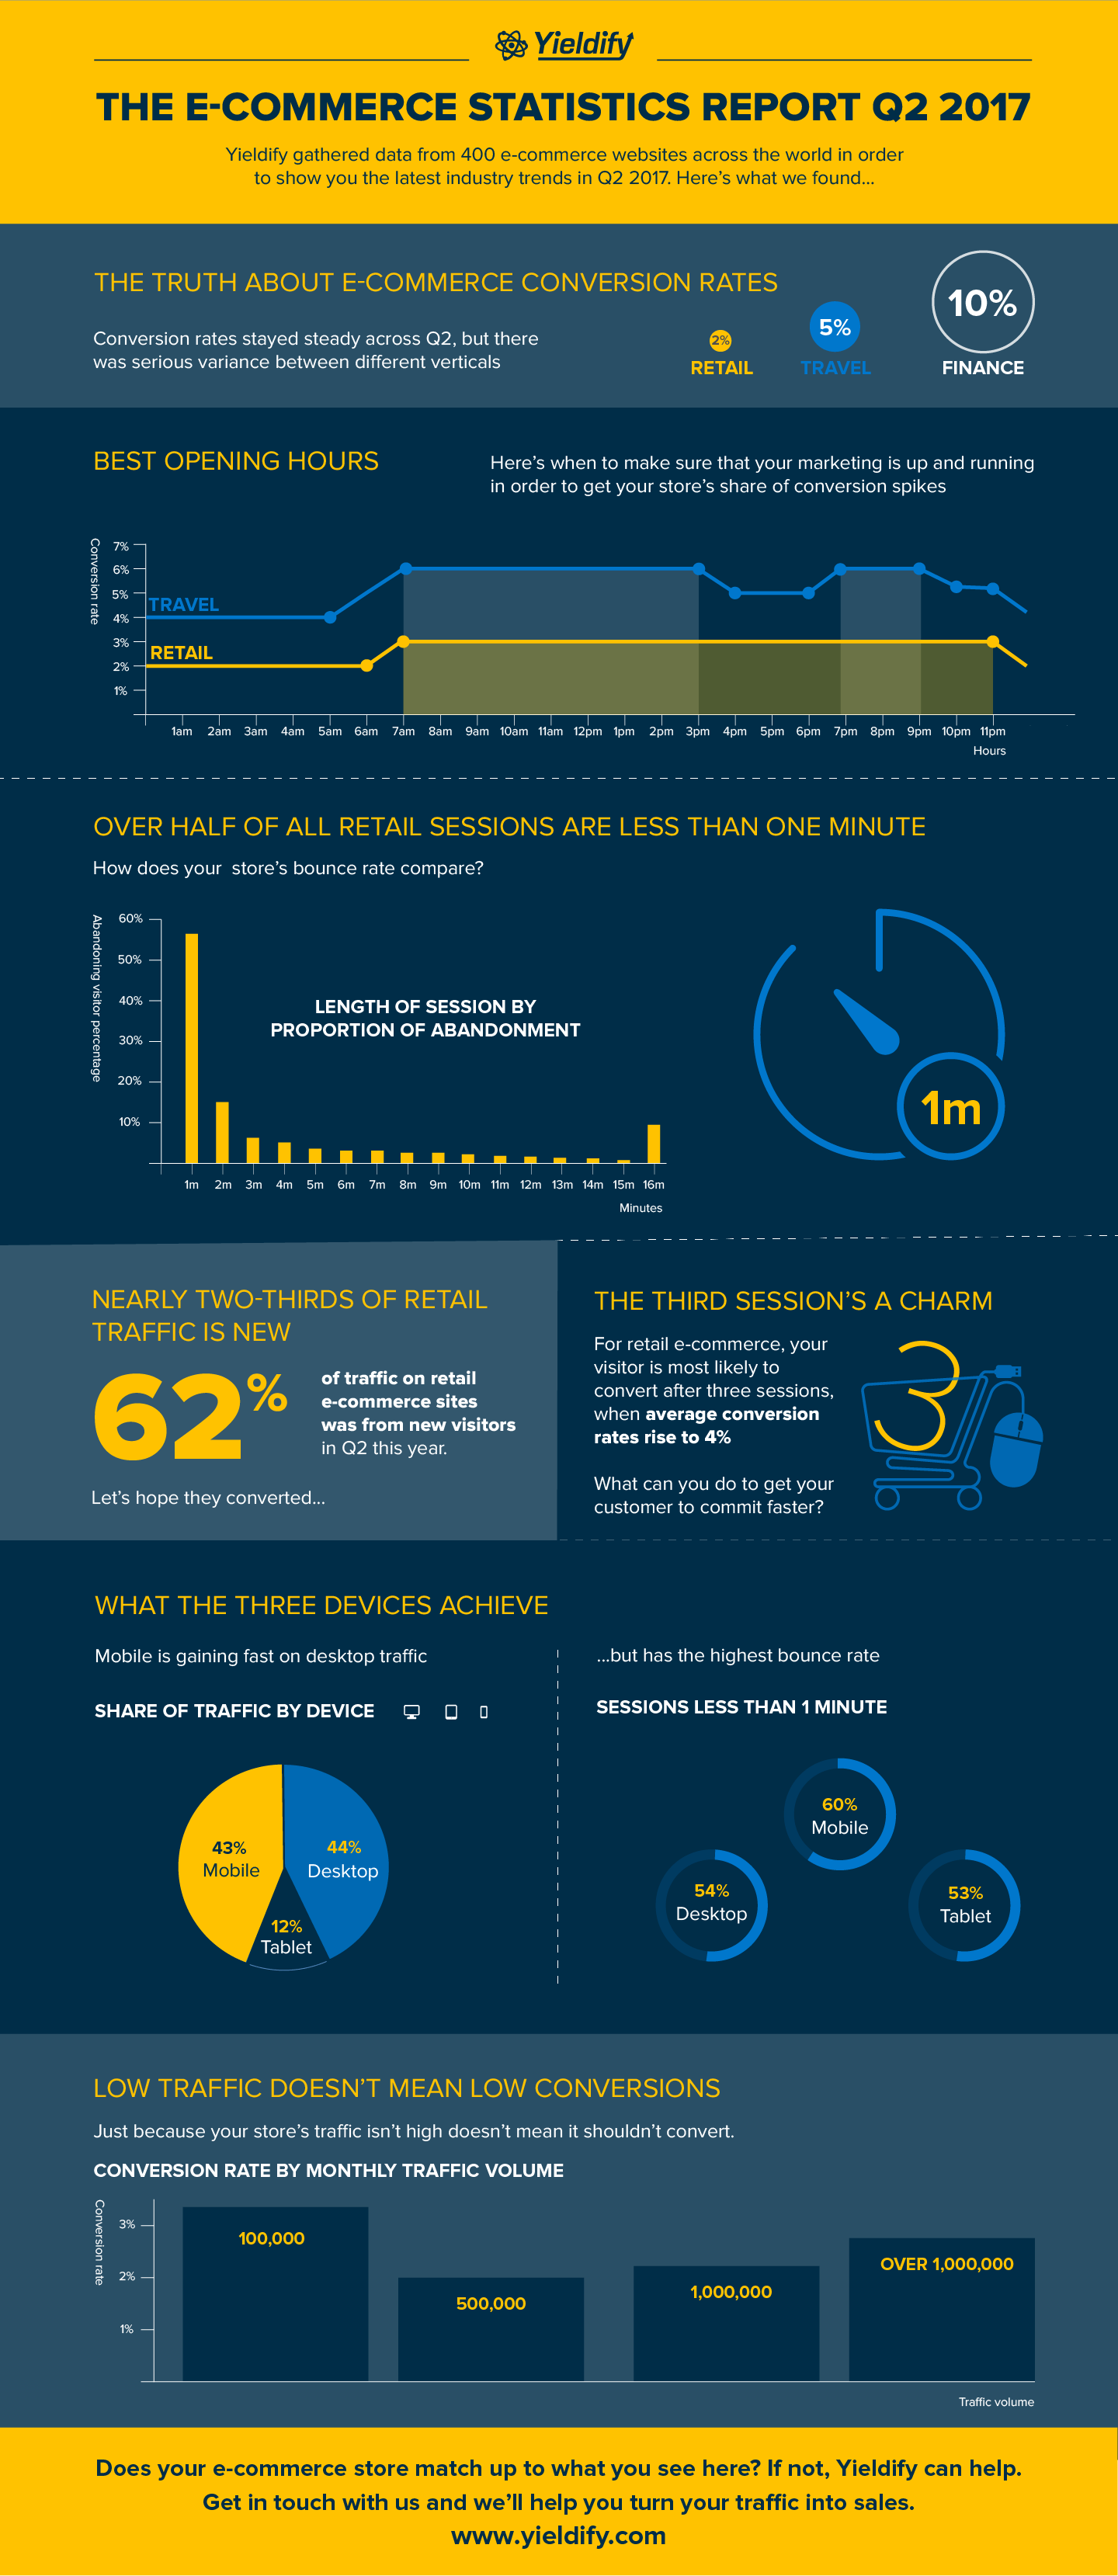
Looking for the latest eCommerce news and insights? Look no further – we’ve drawn the latest facts from hundreds of websites into an infographic packed with the latest eCommerce statistics.
Here at Yieldify, we’re crunching e-commerce statistics daily. So we decided to do it on a macro level and find out what our data could tell us about the e-commerce industry as a whole.
What we found were insights into different devices, visitor types, time trends and much more – check out the infographic below and see if the numbers reflect what you’re seeing on your own store.
In three months’ time we’ll be crunching the numbers again to see how Q3 compares – come back to see whether the summer season impacts retail sales and whether Q4 really starts in Q3…
Do you find it easy to turn your website data into actionable plans?
If not, fear not – our team are experts at understanding visitor behavior data and using it to create strategies that increase your conversions. Get in touch and we’ll show you how we can help.