BLOG
Q1 2019 e-commerce statistics
Published: Apr 24, 2019

What’s the story so far for e-commerce? Check out our Q1 2019 e-commerce statistics to find out!
2018 saw retail and travel e-commerce go through a dramatic period of change. Challenges such as Brexit and GDPR hit the UK market, while Amazon continued its dominance in the US.
Now that we’re a few months into 2019, we decided to look back at the data to understand what e-commerce brands need to know when it comes to traffic, conversions and adjusting their strategy for the rest of the year.
We’ve crunched the numbers from more than 400 million website visits to 180+ e-commerce websites to bring you the story so far via our Q1 2019 e-commerce statistics round-up!
Q1 2019 vs. Q4 2018
First things first – how has 2019 performed so far versus 2018? We compared Q1 2019 to our Q4 2018 e-commerce statistics.
Here are the headline stats:
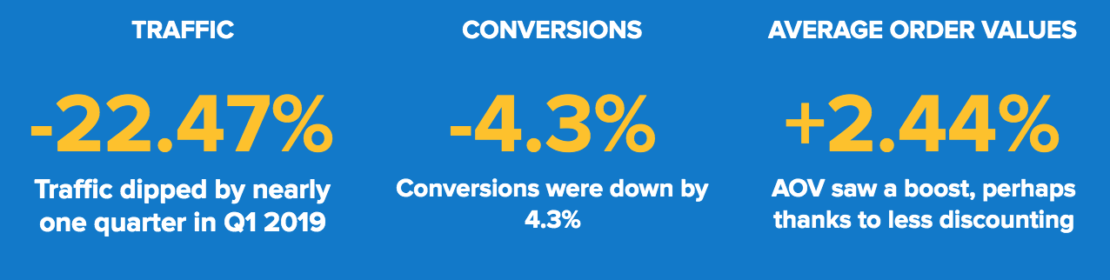
As you might expect, there was a drop in traffic and conversions after the peak shopping season. Conversion rates were down too, the average conversion rate in Q1 was 1.78%. On the bright side, average order values increased. This is likely due to the fact that Q1 2019 is less discount focused than Q4.
A key takeaway for e-commerce marketers is the need to make the most of the traffic you do get during less busy periods. When you don’t have seasonal offers or discounts to tempt visitors to convert you need to ensure your abandonment recovery strategy is en pointe. Read our guide on 5 simple steps to save an abandoned cart to get some tips on improving yours!
When it comes to conversions, timing is everything
When it comes to successful e-commerce marketing time of day and day of week can have a huge impact on the outcome of your efforts to optimize the customer journey and drive conversions. We decided to take a look at average traffic and conversions to get a better understanding of consumer behaviour. Here’s what traffic and conversion rate looks like by hour of day:
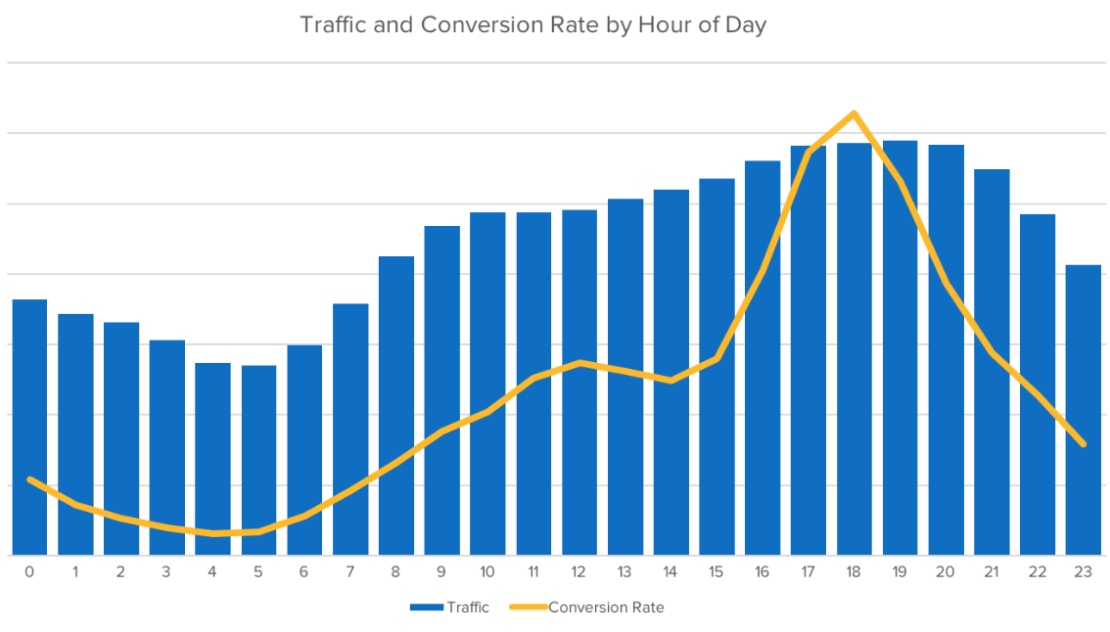
Notice that traffic grows from 8am onwards, peaking between 5pm and 8pm as consumers finish the working day. Conversions peak at two key times – 12pm, so lunch time, and at 6pm.
What does this mean for marketers? Well, it presents an opportunity to personalize throughout the day to reflect the different stages in the journey your customers might be at. For example, employing social proof at lunchtimes or in the evening works well to convert shoppers as they’re already in this high-intent frame of mind.
This is exactly what soak.com did with a campaign utilizing time of day targeting. It used Dynamic Social Proof to create a sense of FOMO (Fear of Missing Out) among mobile users who would otherwise have been casually browsing at lunchtime. The notification showed how many other users had browsed the product in the last 24 hours, indicating popularity:
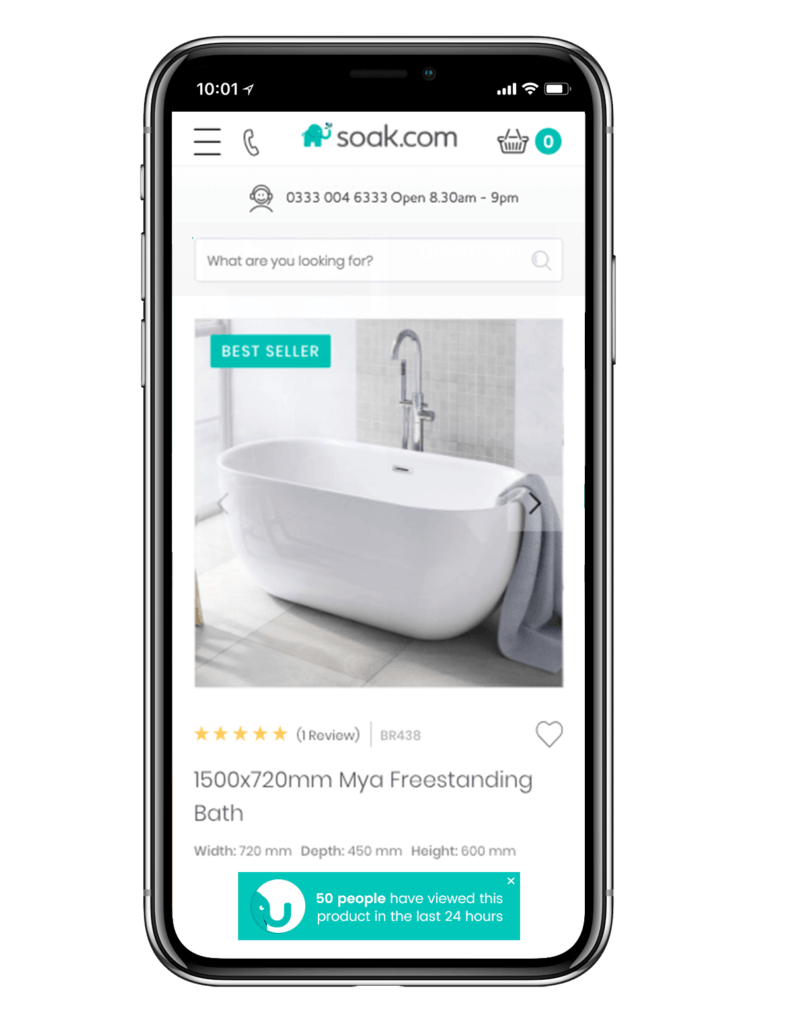
With bathrooms being a high-consideration product with a long purchase cycle, this moved a high-funnel browser further down the path of purchase. As a result, the campaign generated an 11.2% conversion rate uplift in the target group.
Another day, another dollar (if it’s a Saturday)
As well as the time of day, it’s important to track customer behaviour across different days of the week. Our Q1 2019 e-commerce statistics show that Saturdays (followed by Fridays) see the most conversions, but Sundays actually see the most traffic.
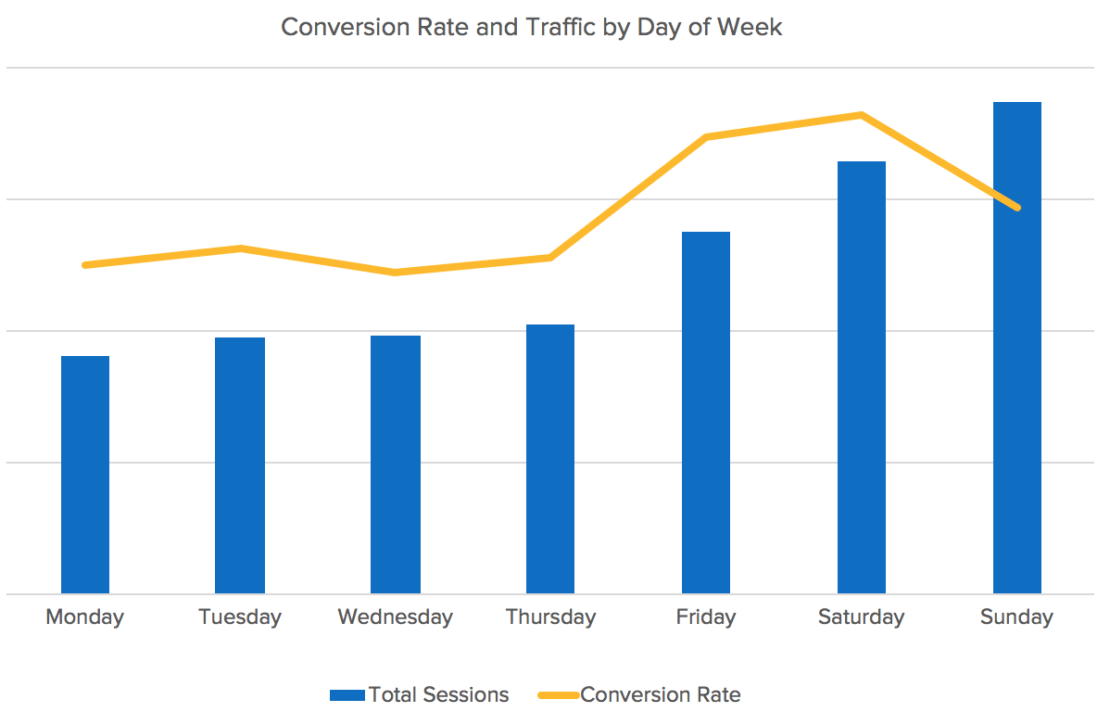
What does this mean for e-commerce marketers? Think about what else you can do to nudge your visitors toward purchase – on a Saturday this might involve creating urgency, while on a Sunday, when visitors are in browsing mode, you might need to help them discover the products that are right for them via personalization and recommendations.
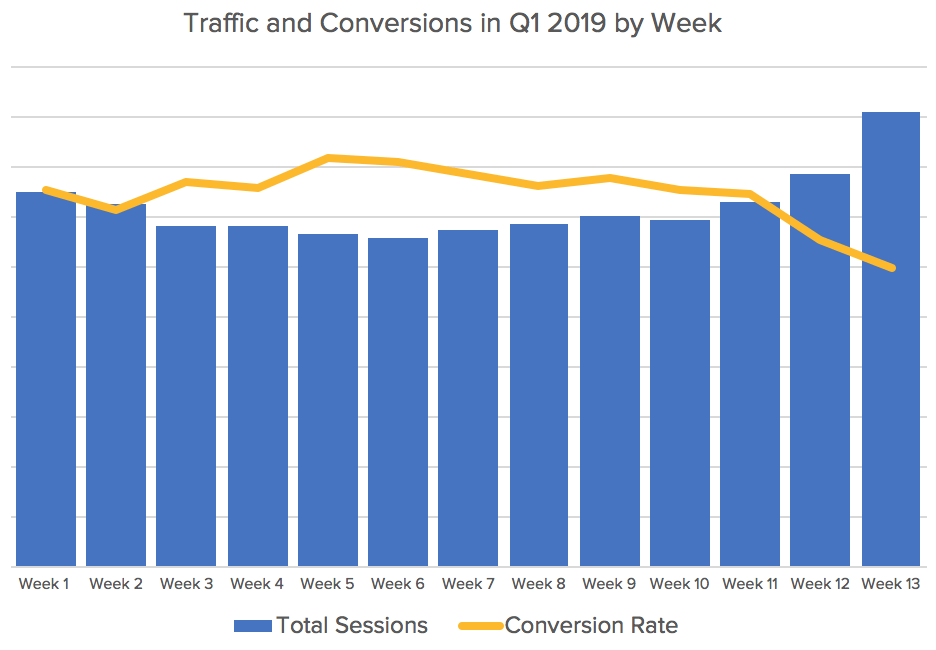
Week by week, when were the peaks?
While Q1 is not as busy as Q4 when it comes to e-commerce shopping holidays, there are a few to take note of. Here are a few of the key dates to keep in mind:
- Weeks 1-2: we saw increased traffic and conversions across the first two weeks of the quarter, likely thanks to the January sales!
- Week 5: we saw conversions spike at the beginning of February and hold pretty strong until week 7 (the week of Valentine’s day!). This shows the importance of getting ready for this first peak of the year.
- Weeks 11-13: Toward the end of Q1 traffic increases, but conversions didn’t tell the same story. What else can you do to convince visitors to become customers?
The key takeaways from these Q1 2019 e-commerce statistics
The statistics and trends we’ve examined here highlight a few opportunities for marketers to improve the customer journey going into Q2 and beyond. Here are a few things to try:
- Test and learn what works during peak while traffic is high, so you can apply this during quieter periods
- Ensure you’re collecting as much data as possible from these visitors so you can remarket to them, and personalize next time they visit
- Delve into the data behind performance based on time and date – you could learn valuable lessons to improve your strategy!